Merchants who install a restock alert app often ask what a good signup rate looks like. It is a fair question, and an awkward one, because we do not have a trustworthy universal number to give you. Rates vary with traffic source, product type, how long an item has been sold out, page design and form friction. Any single figure quoted without that context is more likely to mislead than help. The most useful back-in-stock signup conversion rate is the one you calculate yourself, so this post shows how to do that, what the number means and what tends to move it. The worked example below is illustrative, not data from a real store.
The Formula
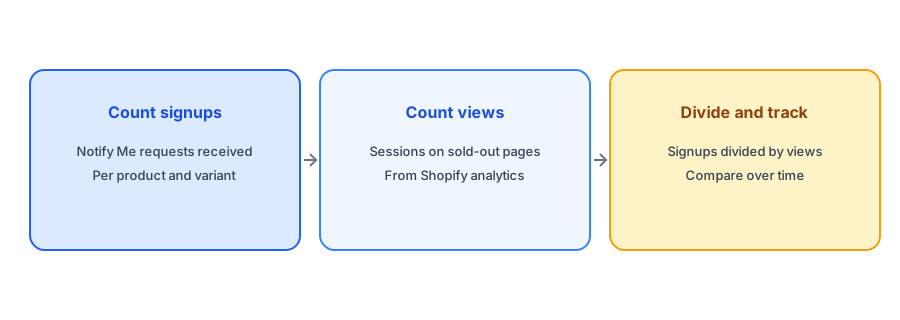
The signup rate is the share of visitors to sold-out product pages who asked to be notified. Divide the number of signups by the number of sessions on those pages, over the same period. If your app reports signups and Shopify analytics reports sessions on the relevant pages, you have both numbers. For clarity, calculate it per product or per collection as well as overall, because a hero product with heavy ad traffic behaves differently from a quiet one.
Illustrative example: suppose a sold-out product page had 500 sessions in a week and 25 people asked to be notified. The rate is 25 divided by 500, which is 5 percent. That figure is made up to show the arithmetic. Your own numbers will differ.
Why Visitors Are Not All the Same
Not every session on a sold-out page is equally likely to sign up. A shopper who arrived from a search for that exact product is far more interested than one browsing from a social post. Visitors who arrive after seeing an ad for an item that is out of stock may bounce regardless of the form. Segment your sessions by source where you can, and be wary of drawing conclusions from a mixed total. Our post on protecting your ad spend from sold-out products explains why traffic to unavailable pages can distort your numbers.
What Tends to Move the Rate
Several things plausibly affect signups, and each is worth testing rather than assuming. Visibility matters: a form below the fold on mobile will be seen less. Friction matters: every extra field costs something, as discussed in our guide to Notify Me form fields. Wording matters: a clear promise such as "Email me when it is back" is easier to accept than a vague button. Timing information matters: a shopper who knows roughly when to expect stock may be more willing to wait. And placement matters, which our post on popup versus inline Notify Me placement explains how to test on a phone.
See how many shoppers ask to be notified. Griffin adds Notify Me to each sold-out variant and is free to start.
Install Griffin on ShopifyInterpreting a Low or High Number
A low rate is not automatically a problem. If most of your sold-out traffic is casual, a low rate is expected. A high rate is not automatically good either: if signups pile up on an item you cannot restock, you are collecting disappointment. What matters is the trend after you make a change, compared against your own baseline. Change one thing at a time, wait for enough traffic and compare equivalent periods. Small stores will see noisy numbers, so lean on counts as well as percentages.
The Rate Is Only the First Half
A signup is a request, not revenue. The number that completes the picture is how many subscribers bought when you restocked. Combine the two and you can estimate what a sold-out page is worth. Our guide to measuring revenue from back-in-stock alerts shows how, and the post on tracking customer demand explains how signup counts can guide reordering.
Keep a Simple Log
You do not need special software to track this. A spreadsheet with a row per week and columns for sold-out page sessions, signups and the resulting rate is enough. Add a notes column for anything you changed, such as a new button label or a different placement, so that a shift in the numbers can be tied to its cause. After a few months, patterns appear: which products attract signups, which seasons are busiest and which changes made a real difference rather than a lucky week. That history is worth more than any benchmark you could borrow.
A Practical Checklist
- Calculate signups divided by sold-out page sessions, per product and overall.
- Segment by traffic source where possible.
- Record a baseline before making any change.
- Change one thing at a time and compare equivalent periods.
- Treat small numbers as hints, not conclusions.
- Follow signups through to restock purchases.
FAQ
What is a good Notify Me signup rate?
There is no reliable universal benchmark. Calculate your own rate and compare it with your own baseline over time.
How do I calculate it?
Divide the number of Notify Me signups by the number of sessions on sold-out product pages over the same period.
What can raise my signup rate?
Better visibility, fewer form fields, a clear button label, honest timing information and good mobile placement are all worth testing.
Is a high signup rate always good?
No. If you cannot restock the item, signups only collect disappointment. Look at how many subscribers buy after a restock.
The Bottom Line
Skip borrowed benchmarks. Measure your own signup rate, test one change at a time and connect signups to restock sales. Griffin is a Shopify back-in-stock app you can install from the Shopify App Store, free to start.