The ABC analysis on its own ranks products by revenue, and it treats a best seller that sells 40 units every week the same as one that sells nothing for a month and then 200 in a weekend. They need very different buying. ABC-XYZ analysis adds a second question: how steady is the demand? Paste each product's revenue and its units per period into the tool below, and it returns the ABC class, the XYZ class and a nine-cell matrix, so you can see which products need tight control, which need a buffer and which need a different approach altogether. The products and numbers shown are examples.
The ABC-XYZ Tool
How the XYZ Class Works
For each product, take the units sold in every period, find the average and the standard deviation, and divide the second by the first. The result is the coefficient of variation: a product that sells almost the same amount every week has a low value, and one that lurches between zero and a spike has a high one. This tool uses the population standard deviation, so every period you paste counts equally.
The cutoffs are a convention, not a law. Published sources use different ones, for example 10 and 25 percent in one and 15 and 30 percent in another, which is why the tool lets you change them. Pick a pair, write it down and use it every time, so changes in a product's class mean something. Shopify's inventory segmentation guide describes XYZ in qualitative terms: steady demand, demand that follows a pattern and sporadic demand.
What Each Group Needs
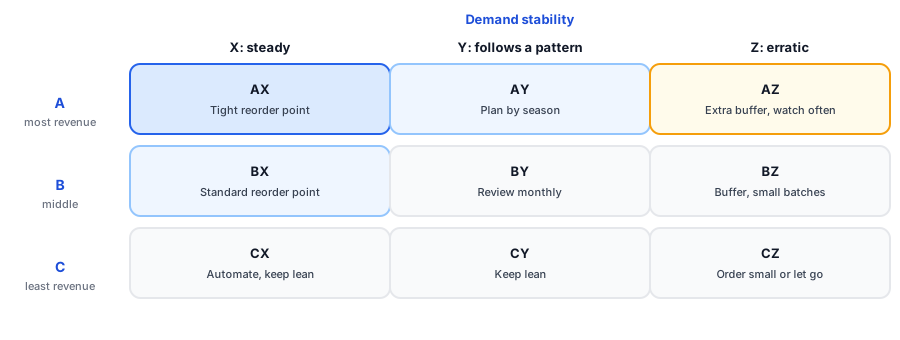
- AX and BX: steady sellers. A standard reorder point works well; use the reorder point and safety stock calculator and check days of stock left each week.
- AY: important with a pattern, often seasonal. Plan ahead with the seasonal inventory planner.
- AZ: the risky group. These matter most and are the hardest to predict, so give them extra buffer, shorter reorder cycles or a faster supplier, and watch them often.
- CX and CY: low revenue but predictable. Keep them lean and automate the reorder.
- CZ: low revenue and erratic. These are candidates for ordering small batches, making to order or letting go; see the dead stock clearance planner.
Traps to Avoid
- Stockouts look like variation. A week at zero because you were out of stock reads as unstable demand. Count only the periods a product was available, or note them and treat the result as unreliable.
- Promotions inflate spikes. A sale week can turn a steady product into a Y. Compare with and without it.
- Too few periods. Six or more weekly or monthly periods give a steadier answer than three.
- Seasonality is not randomness. A product that sells every December and never in June can score Z while being perfectly predictable if you plan by season.
- New products. A launch has little history, so classify it after a few periods.
What Waiting Lists Add
Sales history only counts sales. When a product is sold out, the demand shows up as signups instead. Griffin, a Shopify back-in-stock app, adds a Notify Me popup or inline form to sold-out products, and shoppers sign up for the variant they want. Because signups are recorded per product and variant, a Z product with a long waiting list tells you the real demand was higher than its sales; our guide to tracking demand on out-of-stock products shows how to read it. The free plan includes 100 notifications a month. Griffin does not rank or classify products. For the revenue half of this analysis, start with the ABC analysis tool.
Your erratic best sellers will sell out. Griffin makes sure the demand you cannot serve still shows up as signups.
Install Griffin on ShopifyFAQ
What is ABC-XYZ analysis?
It combines two rankings. ABC sorts products by how much revenue they bring in, and XYZ sorts them by how stable their demand is from period to period. Crossing them gives nine groups, such as AX for a high-revenue, steady seller and AZ for a high-revenue product with erratic demand.
How is the XYZ class calculated?
Take the units sold in each period, work out the average and the standard deviation, and divide one by the other to get the coefficient of variation. Low values mean steady demand (X) and high values mean erratic demand (Z). The cutoffs are a convention that differs between sources, so choose them and keep them fixed.
How many periods of sales do I need?
Use at least six weekly or monthly periods per product if you can, and the same window for every product. With very few periods one unusual week can swing the result.
Does Griffin classify products this way?
No. Griffin captures restock signups on sold-out products and variants and emails those shoppers when the item is back. It does not rank products, though waiting lists can show demand a sales history cannot.
The Bottom Line
ABC tells you which products matter, and XYZ tells you which are hard to plan. Together they point your attention at the AZ group first and let you relax about the rest. Griffin is a Shopify back-in-stock app you can install from the Shopify App Store, free to start.