Sell-through rate answers a plain question: of the stock I had, how much did I sell? It is one of the quickest ways to see whether a product is flying, crawling or about to run out. It is also a number that different guides calculate differently, which confuses merchants who check two sources and get two answers. The calculator below shows three common versions side by side so you can see exactly where they agree and where they split. If you were looking for a sell-through rate calculator you can use in a minute, enter three numbers and read the results. The values shown are examples.
The Calculator
Why the Formulas Disagree
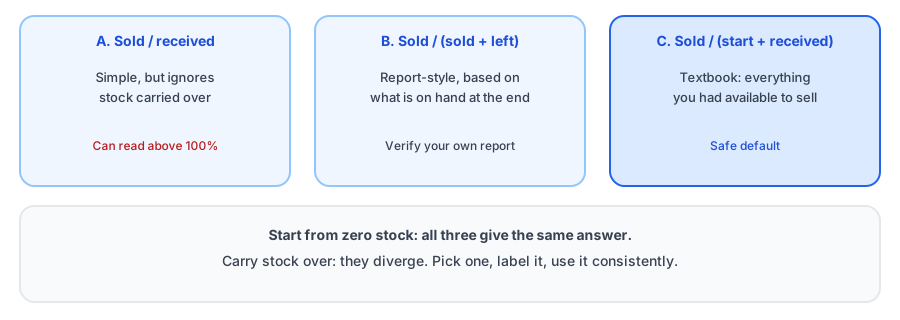
Guides about Shopify give more than one definition. Shopify's inventory formulas page describes sell-through as units sold divided by units received, while another Shopify article uses sales divided by stock on hand. Third-party descriptions of the report in the Shopify admin say it divides units sold by units sold plus the units still on hand; confirm how your own report calculates it before you rely on it. The textbook version divides units sold by everything available to sell, meaning starting stock plus what you received. They all agree when you start from zero stock, because then received equals available. They split when you carry stock from a previous period, and the received-only version can even exceed 100 percent. Pick one definition, label it, and use it consistently, so changes in the number mean something.
What a High or Low Rate Should Make You Do
Rate high: check for missed demand
A rate near 100 percent can mean you sold nearly everything, which is good, or that you ran out partway through and left sales on the table. Look at how many days the product was unavailable. Then protect it with a proper reorder point, using our reorder point calculator, and make sure a sold-out page captures demand; our sold-out page checklist shows how. To see what a stockout cost, use the lost-sales calculator.
Rate low: ask why before you act
A low rate can mean slow stock, but it can also mean a short period, a seasonal product or an over-ordered batch. Shopify's guide cites 80 percent as a commonly used marker, but a good number depends on your category and period, so treat it as a rule of thumb and not a target. If a product is genuinely slow, consider a promotion; if it keeps selling out of some variants while others sit, the problem is the mix, and our post on size runs explains why.
High sell-through means some demand will meet an empty shelf. Griffin captures that demand with Notify Me on sold-out variants.
Install Griffin on ShopifyChoosing the Period
Sell-through depends heavily on the time window. A week is noisy, a year hides seasonality, and a stretch that includes a sale will flatter a product that normally sells slowly. For most stores, comparing the same product over a consistent period, such as a month or a season, works best. Keep the window the same each time so you can see the trend, and note when a promotion or a stockout fell inside it, since either one changes what the number means.
Use It With Your Other Numbers
Sell-through is most useful next to a few other measures: how many days of stock you have left, your reorder point, and how many people are waiting on sold-out items. A waitlist is a direct record of demand you could not serve, and Griffin's dashboard shows which products are in demand; our guide to tracking demand on out-of-stock products explains how to read it. Before a sale, combine your sell-through with the stock allocation calculator so you know how much to promote. Griffin does not calculate sell-through; it shows demand from restock signups.
FAQ
What is sell-through rate?
It is the share of the stock available to you that you sold in a period. A high rate means stock is moving; a low rate means it is sitting.
Why do different guides give different formulas?
Because there are several common ways to define the denominator: units received, units on hand at the start, or units sold plus units still on hand. They agree when you start from zero stock and diverge when you carry stock over.
What is a good sell-through rate?
Shopify's own guide cites 80 percent as a commonly used marker, but a good rate depends on your category, the length of the period and whether you want to avoid stockouts. Treat any single number as a rule of thumb.
Is a very high sell-through rate always good?
Not necessarily. A rate near 100 percent can mean you sold out and missed demand. Check whether the product spent time out of stock before celebrating.
The Bottom Line
Pick one sell-through formula, state which one, and read the result in context: period length, seasonality and whether the product ran out. A high number is a prompt to protect supply, and a low one is a prompt to ask why. Griffin is a Shopify back-in-stock app you can install from the Shopify App Store, free to start.